
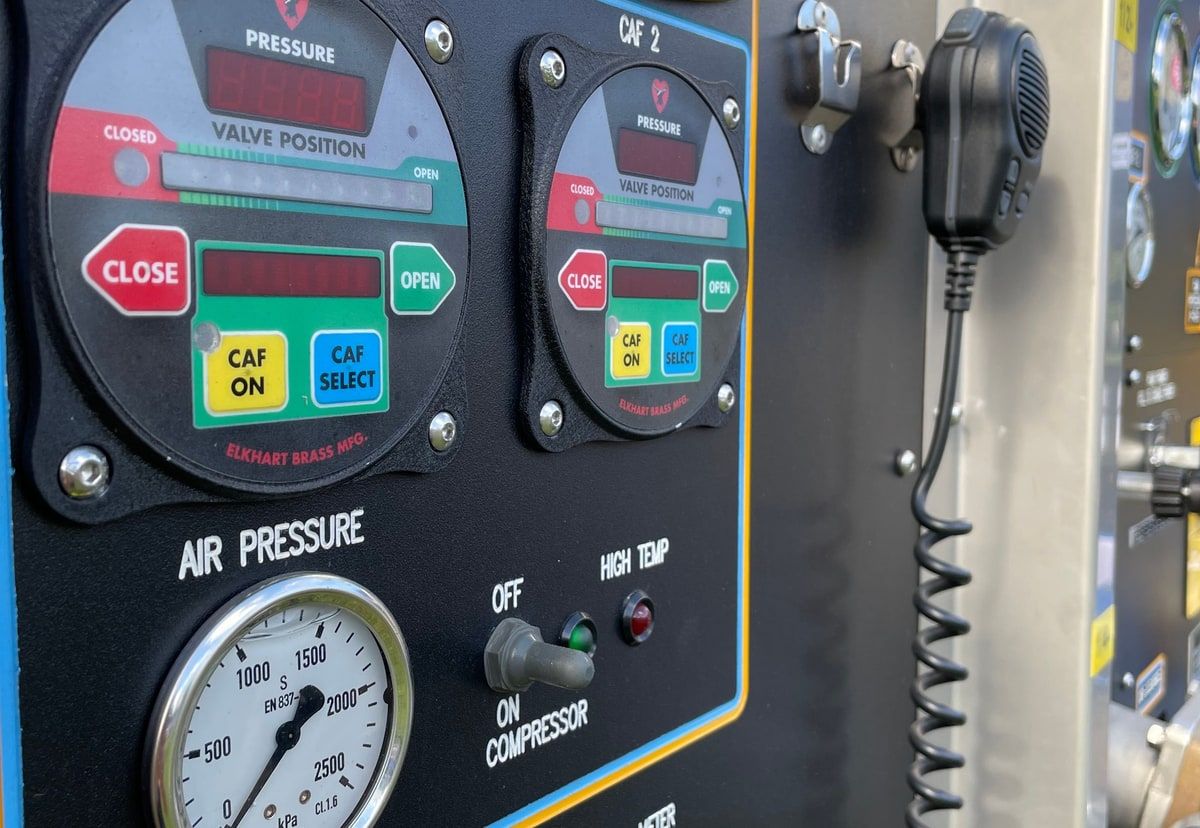
A website can return a healthy response while the part customers need is completely broken. Monitoring needs to prove more than uptime. It should test important journeys, reveal useful evidence and reach somebody who knows what to do next.
01
The dashboard can be green while the application is broken
The homepage loads. The server answers. The uptime chart stays green. Meanwhile, customers cannot sign in because the identity provider has failed. A background job has stopped processing documents. The checkout accepts a card but never creates the order.
From the outside, the application is available. From the customer's point of view, it is not working.
That gap explains why website and app monitoring is not one product category with one obvious winner. Different tools answer different questions. Some tell you whether a page responds. Some repeat a real browser journey. Some group application errors. Others connect traces, logs, servers and databases so a development team can investigate the cause.
The ten tools below are not ranked from best to worst. They cover different monitoring jobs. The useful choice is the one that proves an important service is working, reaches the right person when it is not and provides enough evidence for that person to act.
02
Decide what working means before choosing a tool
Monitoring begins with a service promise, not a dashboard.
For a brochure website, working might mean that important pages load from several locations, the domain and SSL certificate remain valid and a contact form accepts a controlled test submission. For a customer portal, it could mean that a user can sign in, open a case, upload a document and see the correct status. For an internal application, it may include scheduled imports, queue workers and an integration with a finance system.
A basic HTTP check is still worth having. It gives an independent signal when the whole service is unavailable. The mistake is treating that signal as proof of every workflow behind it.
| Monitoring layer | Question it answers | Example check |
|---|---|---|
| Availability | Can the service be reached? | Request the homepage or health endpoint from several locations |
| Synthetic journey | Can a user complete an important task? | Sign in, submit a form and confirm the success screen |
| Error tracking | Is the application throwing exceptions? | Group a repeated checkout error and connect it to a release |
| Application performance | Where is a request becoming slow? | Follow a trace through code, database queries and external APIs |
| Infrastructure and logs | What is happening around the application? | Watch memory, disk, containers, workers and log events |
| Business signal | Did the intended result happen? | Confirm that orders, documents or renewals were processed |
Most established applications need more than one monitoring layer. They do not necessarily need one enormous platform that collects everything.
03
Ten monitoring tools at a glance
Capabilities and prices change quickly, so this is a shortlist rather than a permanent scorecard. Verify runtime support, data retention, alert channels, hosting regions, security controls and current pricing with the supplier before committing.
The strongest fit describes the job each product is particularly useful for. It is not a claim that the tool can only do that job.
| Tool | Strongest fit | What it adds | Main watch-out |
|---|---|---|---|
| UptimeRobot | Straightforward external checks | Website, endpoint, keyword, port, cron, SSL, DNS and status monitoring | It tells you that a check failed, not necessarily why the application failed |
| StatusCake | Small teams wanting broad website checks | Uptime, page speed, SSL, domain and server monitoring | Deeper application diagnosis will need another tool |
| Better Stack | Monitoring tied to incident response | Uptime, browser transactions, cron checks, escalation and status pages | The workflow only helps if ownership and escalation are maintained |
| Pingdom | Synthetic and real user website monitoring | Availability, page speed, transactions and real visitor performance | Compare its current packaging and cost with newer alternatives |
| Checkly | Developer owned synthetic monitoring | Playwright journeys, API checks, monitoring as code and failure evidence | The team must be comfortable maintaining tests as code |
| Grafana Cloud | Teams already using Grafana and open telemetry | Synthetics joined with metrics, logs and traces, plus k6 based checks | Dashboards, labels and alert rules still need careful design |
| Uptime Kuma | Self hosted availability monitoring | HTTP, TCP, DNS, Docker and other checks with many notification options | You own hosting, updates, backups and the monitor that watches the monitor |
| Sematext | One platform across several monitoring layers | Synthetics, real user monitoring, infrastructure, logs and tracing | Data volume can make scope and cost harder to judge |
| Sentry | Development teams starting from errors | Exception grouping, releases, traces, profiles and application context | It only sees what has been instrumented properly |
| Datadog | Complex or distributed systems | APM, infrastructure, logs, databases, synthetics, RUM and correlation | Breadth, telemetry volume and retention need active cost control |
04
UptimeRobot and StatusCake cover the website essentials
UptimeRobot focuses on the checks most businesses should have before they add anything clever. It can monitor websites and endpoints, look for the presence or absence of a keyword, test ports and pings, watch cron jobs and alert on SSL, domain or DNS problems.
That makes it a sensible choice for a small estate or as an independent outside check alongside a deeper application tool. A public status page can also give customers one place to see whether a known incident is being handled.
StatusCake combines uptime checks with page speed, SSL, domain and server monitoring. That is helpful when the immediate risks are less about distributed services and more about everyday website operations: a page becoming slow, a certificate expiring, a domain changing or server resources crossing a threshold.
Both products are broad website monitoring options rather than deep application debuggers. Monitoring the homepage every minute will not prove that the contact form, account area or payment journey works. The list of checks should follow the useful customer journeys, not the navigation menu.
05
Better Stack and Pingdom add more of the user journey
Better Stack combines uptime monitoring with browser transactions, cron monitoring, incident management, escalation and customer status pages. Its Playwright based transaction checks can run a real Chrome browser through important interactions rather than checking only one URL.
That joined workflow can reduce a common operational gap. One tool detects the problem, another holds the rota and a third communicates with customers. When those parts are separated, the alert can lose context or ownership while people work out who should respond.
Pingdom is one of the established names in website monitoring. Its synthetic monitoring can check availability, page speed and transactions such as registration, login, search or checkout. Real user monitoring adds evidence from the browsers and locations of actual visitors.
Synthetic and real user views answer different questions. Synthetic tests run a controlled journey repeatedly, even when no customer is using the service. Real user monitoring shows the performance people actually received across devices, browsers and regions.
06
Checkly and Grafana Cloud make monitoring part of delivery
Checkly is aimed at teams that want browser and API monitoring to live close to development. It uses Playwright for real browser checks and can reuse tests already written for important flows. Checks can sit in the repository, pass through review and be deployed with the application.
This is useful when a customer journey is too important for a basic click recorder. A developer can express the real rules: authenticate, create a record, verify the response, confirm the correct data and clean up the controlled test record. When a browser check fails, screenshots, video and trace information can shorten the investigation.
Grafana Cloud Synthetic Monitoring uses k6 to test websites, APIs, network endpoints and browser journeys. The bigger advantage appears when the team already uses Grafana for metrics, logs and traces. A failed journey can be investigated beside the operational signals behind it.
Monitoring as code is software. When the interface or authentication flow changes, the check must change deliberately. That is a strength when the team owns it and a source of false alarms when nobody does.
07
Uptime Kuma gives a technical team a self hosted option
Uptime Kuma is an open source, self hosted monitoring tool. It supports HTTP and HTTPS, TCP, keyword and JSON queries, WebSockets, ping, DNS, push checks and Docker containers, with a wide range of notification services and multiple status pages.
It can suit a technical team that wants control over a straightforward availability monitor and is comfortable running it. It is especially useful for internal services or environments where a hosted monitor is not the right fit.
Self hosted does not mean free of operational cost. The monitoring service needs updates, backups, security and its own independent health signal. If Uptime Kuma sits on the same server and network as the application, both can disappear together without an external alert. Independence is part of monitoring design.
08
Sematext joins several monitoring layers
Sematext offers synthetic monitoring, real user monitoring, infrastructure monitoring, logs and tracing. Its synthetic checks can watch websites and APIs from several locations, while the broader platform provides the evidence needed to move from detection towards diagnosis.
That makes it relevant when a team wants one supplier across several layers but does not need the full scale of the largest observability platforms. The joined view can help connect a slow page to application, host or log behaviour.
The decision needs a realistic data model. Which capabilities are required now? How much data will each one create? How long must it be retained? Buying every layer because it is available can produce a busy platform that nobody has time to interpret.
09
Sentry is strong when developers begin with an error
Sentry is widely known for error tracking. It groups exceptions, connects them to releases and adds traces, profiles and performance context around the failure. For a development team, that can make it easier to move from a customer report to the affected code and version.
It complements external monitoring. An uptime check can prove that the service is unreachable from outside. Sentry can show that one workflow is throwing an exception even while every external availability check passes.
Good instrumentation matters. Sensitive data should be removed before it leaves the application, releases and environments need consistent names, and sampling must preserve the uncommon failures the team is likely to investigate. Installing an SDK is the start of monitoring, not the finished setup.
10
Datadog suits broad, distributed operational estates
Datadog brings application performance monitoring together with infrastructure, logs, databases, synthetic checks, real user monitoring and other operational data. That breadth is useful when one customer action crosses several services and platforms owned by different teams.
A trace can follow the request through those services, while related logs and infrastructure signals help explain whether the problem came from code, a database, a host or an external dependency. This is valuable in a genuinely complex environment.
It can be excessive for a modest application with one team. Telemetry volume, retention and high cardinality fields all affect cost and usability. Start with the journeys and services that matter. Collecting every possible signal before anybody has defined the investigation usually creates an expensive haystack.
11
Build a monitoring stack, not a monitoring collection
A sensible setup can be small. For a brochure or lead generation website, use an independent uptime check, monitor the contact journey, watch the domain and certificate, and make sure alerts reach somebody who can act.
For a business portal, add error tracking, queue and scheduled job monitoring, a synthetic login and one complete high value workflow. Include a business signal such as documents processed or approvals completed so the team can see whether the technical system is producing the intended result.
For a distributed SaaS product, add traces, logs, infrastructure signals, real user monitoring and service ownership. Keep an external synthetic check outside the main platform so a failure of the observability provider or network path does not make the system invisible.
Do not duplicate every signal across several products. Each tool should have a clear job and a clear owner. Record where somebody starts an investigation, where customer updates are published and which system is trusted for each type of evidence.
12
A good alert contains a decision
The quality of monitoring is easier to judge at 2am than in a sales demonstration.
An alert should say what failed, which service and environment are affected, when the problem began, whether it has been confirmed from another location and where the responder can see useful evidence. It should reach a named person or rota with the authority to act.
Different conditions deserve different routes. A single slow request may be a dashboard signal. A sustained rise in failed checkouts may need an urgent page. An expiring certificate might create a task several weeks before it becomes an incident.
Test the notification path. Pause it during planned maintenance. Remove old recipients. Review false alerts and missed incidents. If the team receives ten unactionable messages for every real problem, the monitoring system is training people to ignore it.
13
Start with one journey and prove the response
Choose one business journey that matters, such as signing in and submitting a case. Write down what success means, how quickly a problem should be detected and who owns the response.
Add one external availability check, one synthetic journey and the application evidence needed to diagnose a failure. Break the journey safely in a test environment. Confirm that the alert arrives, contains enough context and leads to a useful action. Then repeat the exercise for the next important workflow.
The best website and app monitoring tool is not the one with the most graphs. It is the tool that helps the right person discover a real problem, understand its impact and restore the service before a customer has to explain what broke.
DanJMills helps established businesses take control of important web applications, including monitoring, deployment, support and technical risk. If a business critical application is difficult to observe, the first useful step is to map the journeys that matter and decide which signals prove they are working.
Useful questions
Website and app monitoring checklist:
- Which customer or staff journey matters most?
- Does an external check prove the service is reachable from more than one location?
- Does a synthetic test prove the whole useful journey rather than one page?
- Are errors connected to releases, environments and the affected workflow?
- Are scheduled jobs, queues, certificates, domains and integrations being watched?
- Is sensitive data removed before logs and traces leave the application?
- Does every urgent alert have a named owner and a documented action?
- Can customers see accurate incident updates when service is affected?
- Has the notification route been tested rather than merely configured?
- Can the team explain which tool is trusted for each monitoring job?